


Kliker
KLIKER Market is a market intelligence web application that aggregates product offers from selected online retailers in each target market. It pulls live pricing, assortment and promotion data into searchable tables, interactive dashboards and alerts, giving brand and retail teams a clear view of their digital shelf and competition so they can adjust pricing, monitor listings and plan next steps with less manual work.

Dedicated portals for brands and retail teams
Cross-device access to all key metrics
Custom front-end integrated with Symfony
Challenge
The client approached us at a point when KLIKER Market had outgrown its original interface. New modules and metrics had been added release by release, which led to dense screens, overlapping sections and even different labels for the same concepts. Users struggled to see where to start, understand the difference between areas like Dashboard and Analytics, and quickly find the indicators they needed, so everyday analysis took more effort than it should.
A clearer structure for complex data
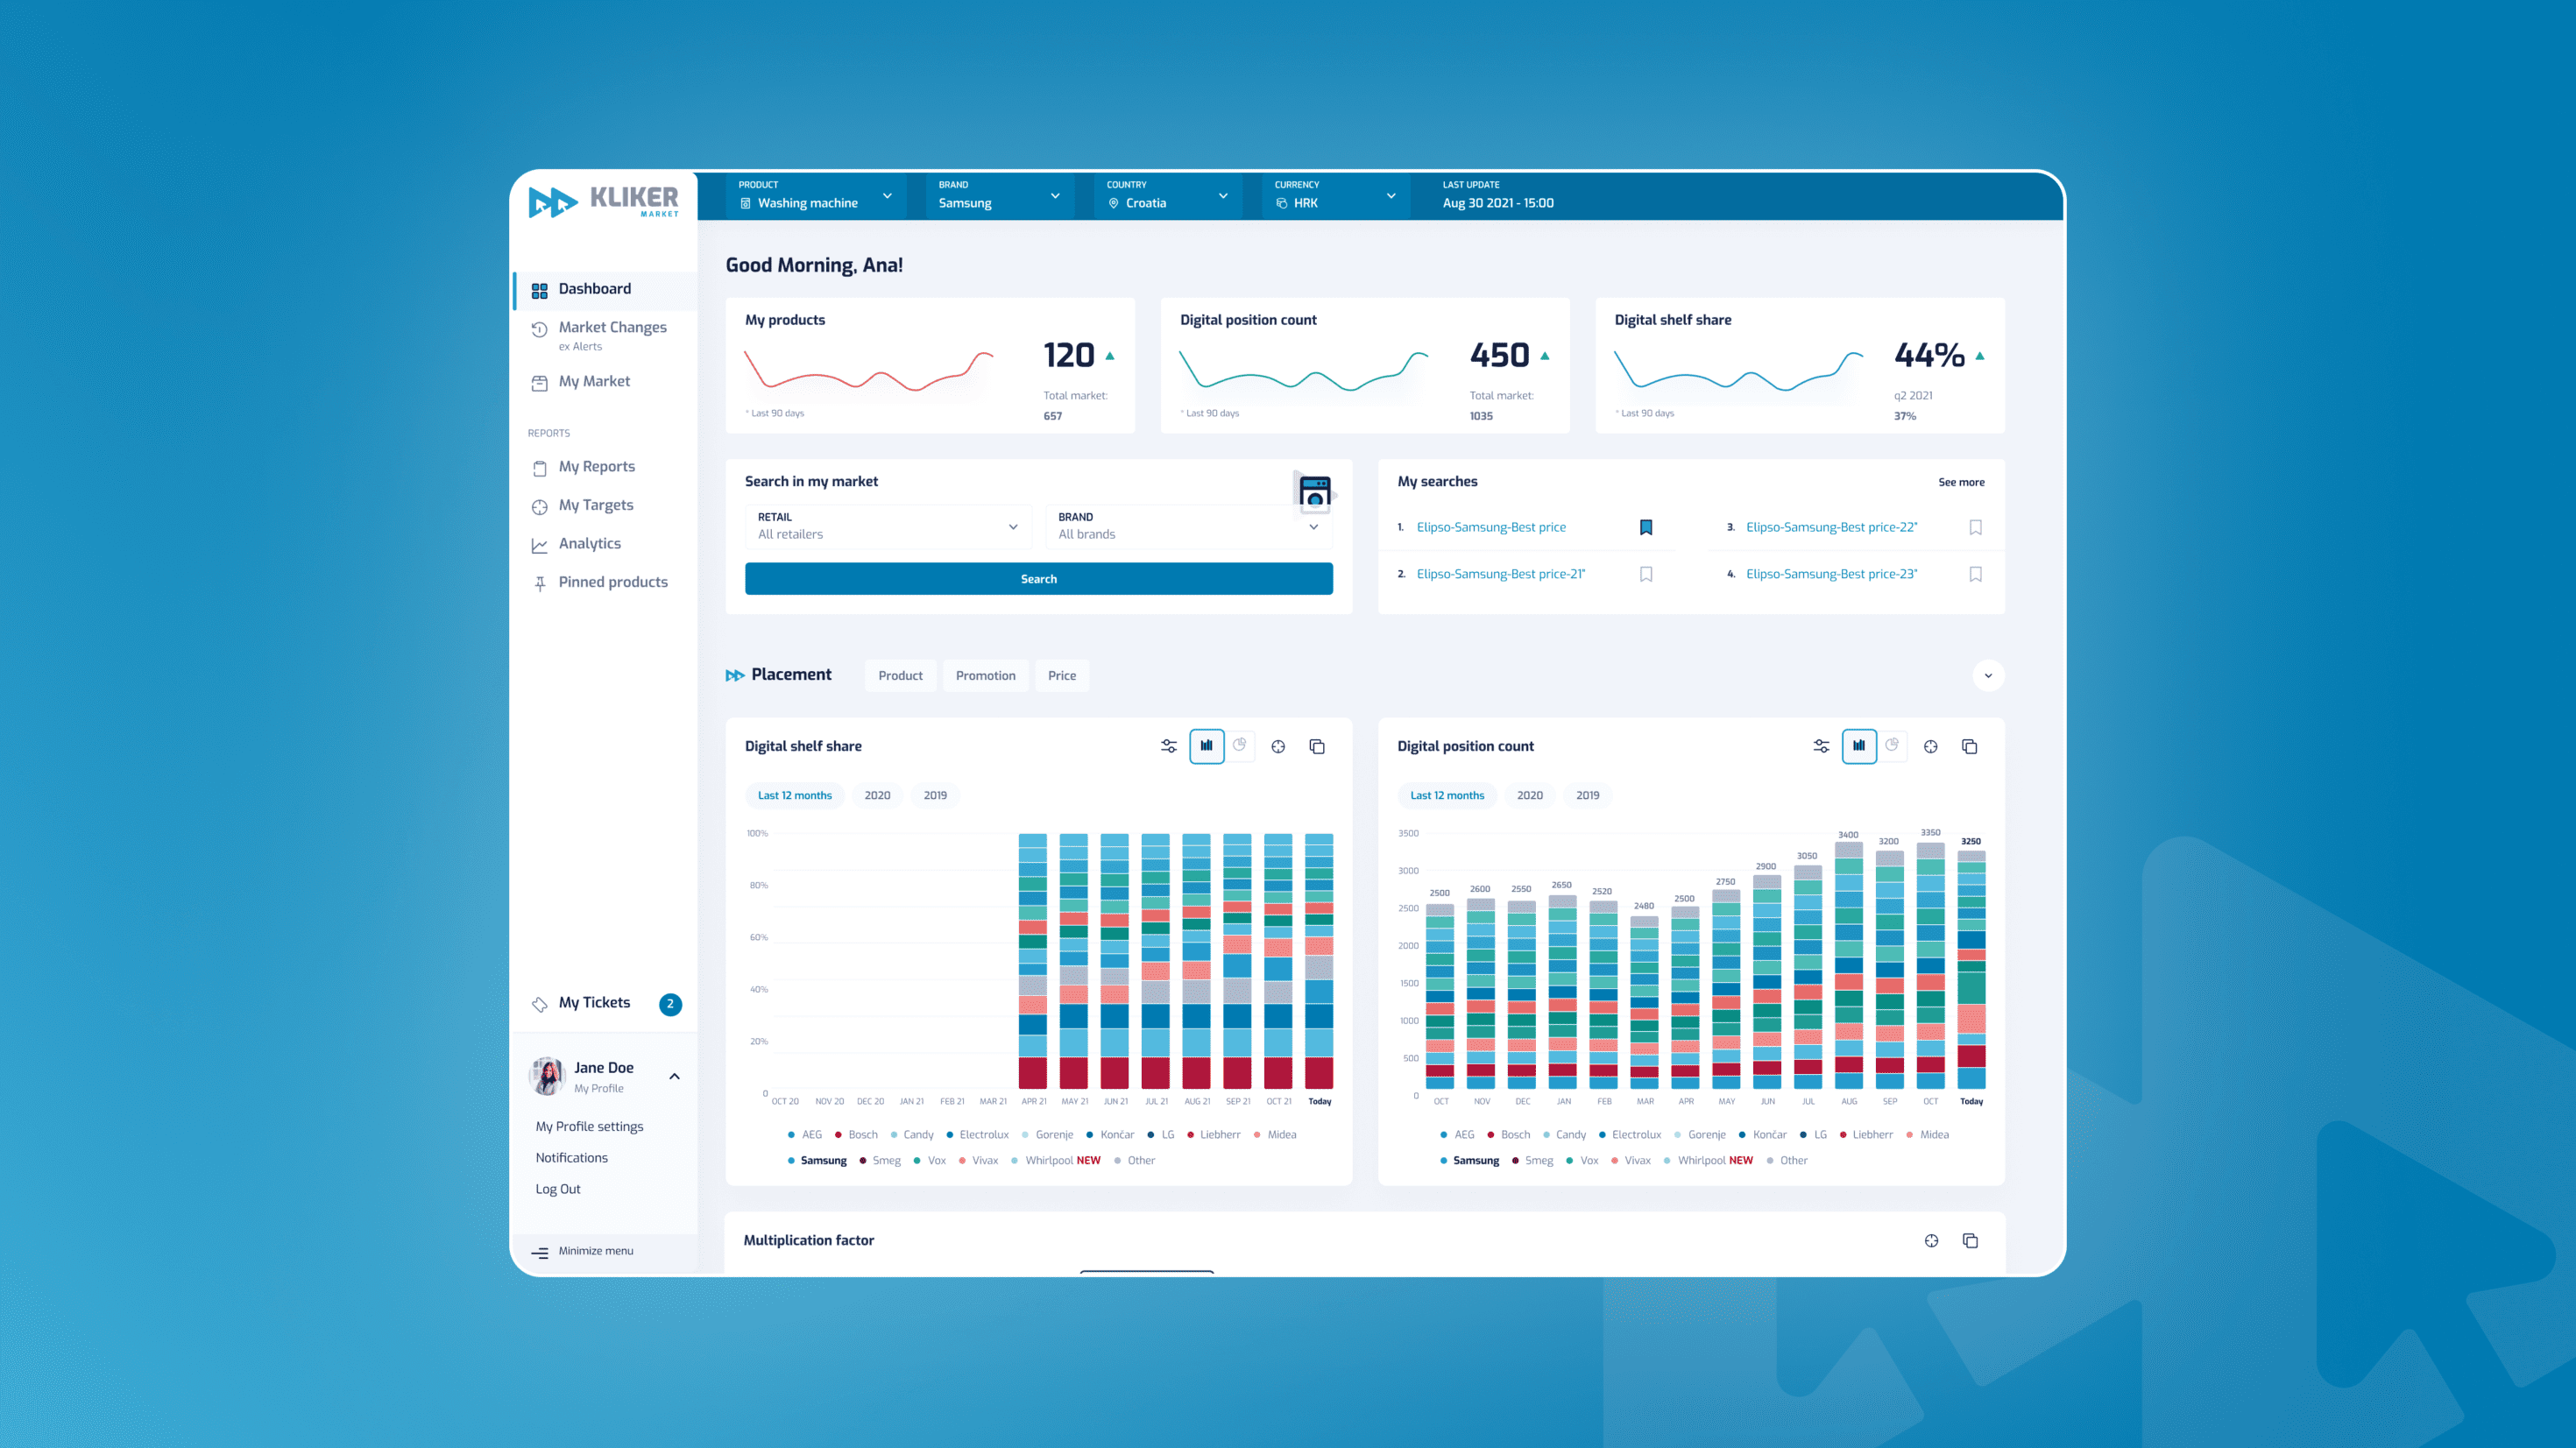
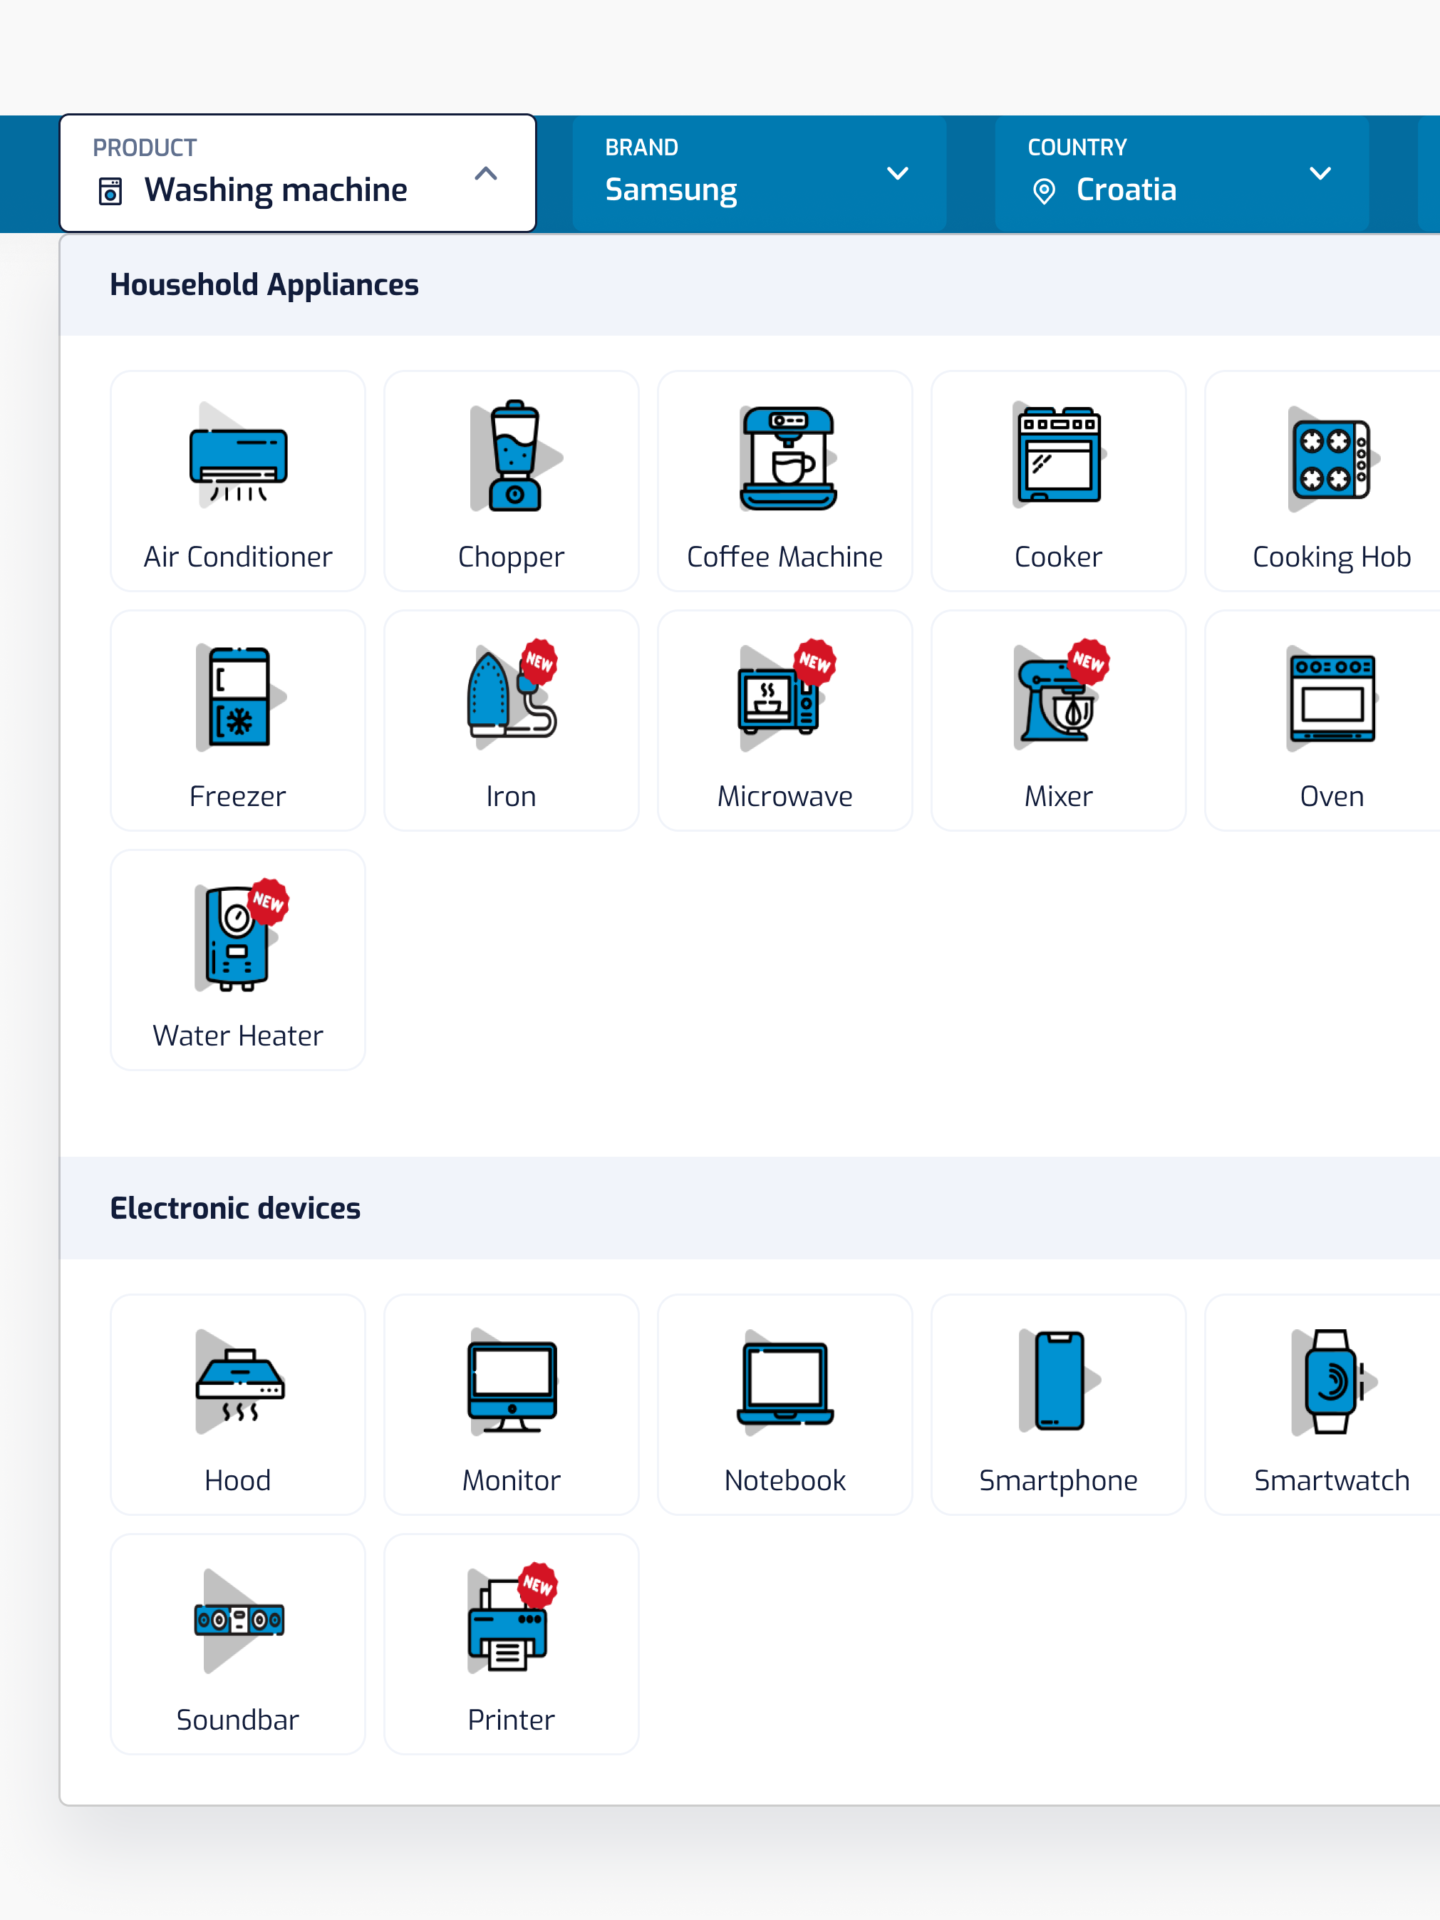
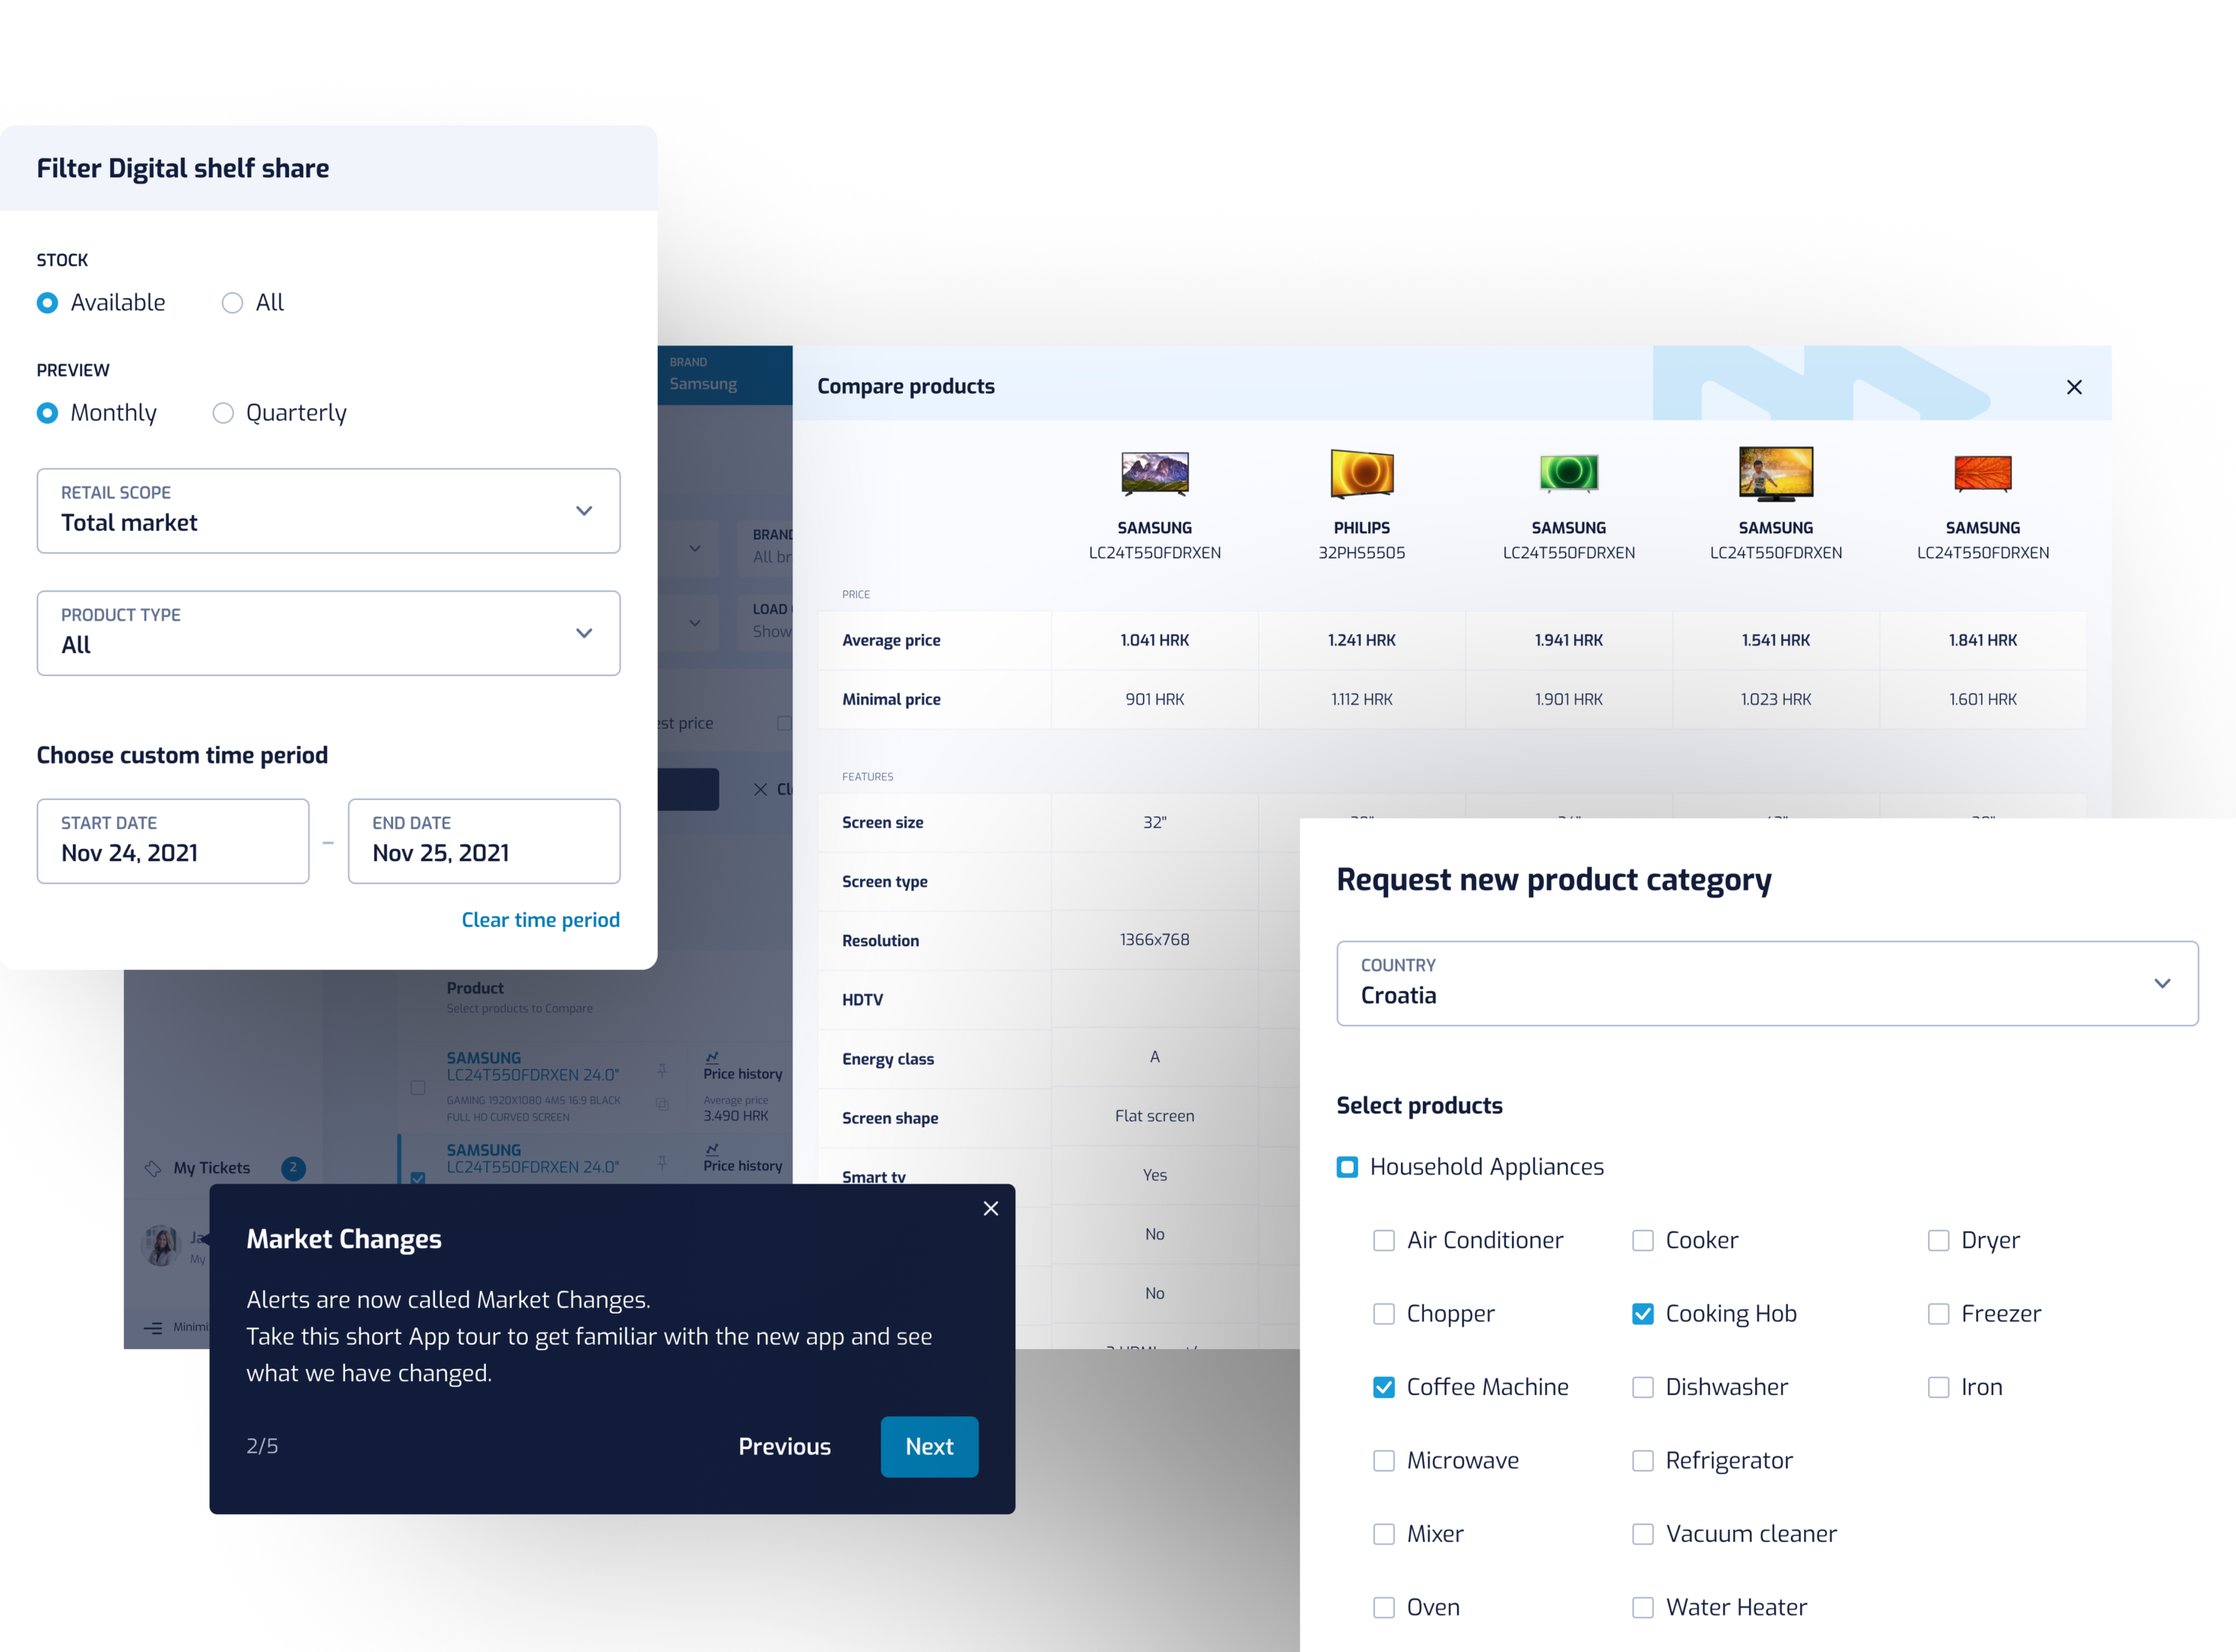
Our goal was to keep the experience clear and usable, even with thousands of products and metrics on screen. We organised the product into a clear left-hand navigation with dedicated spaces so power users always know where to start. Additionaly we refined iconography and table behaviour, from locking the first retailer in comparison tables to adding status labels, while filters, saved searches and tags showing the selected retailer or product sit right next to the data, making it easier to scan long lists and drill into details without losing context.
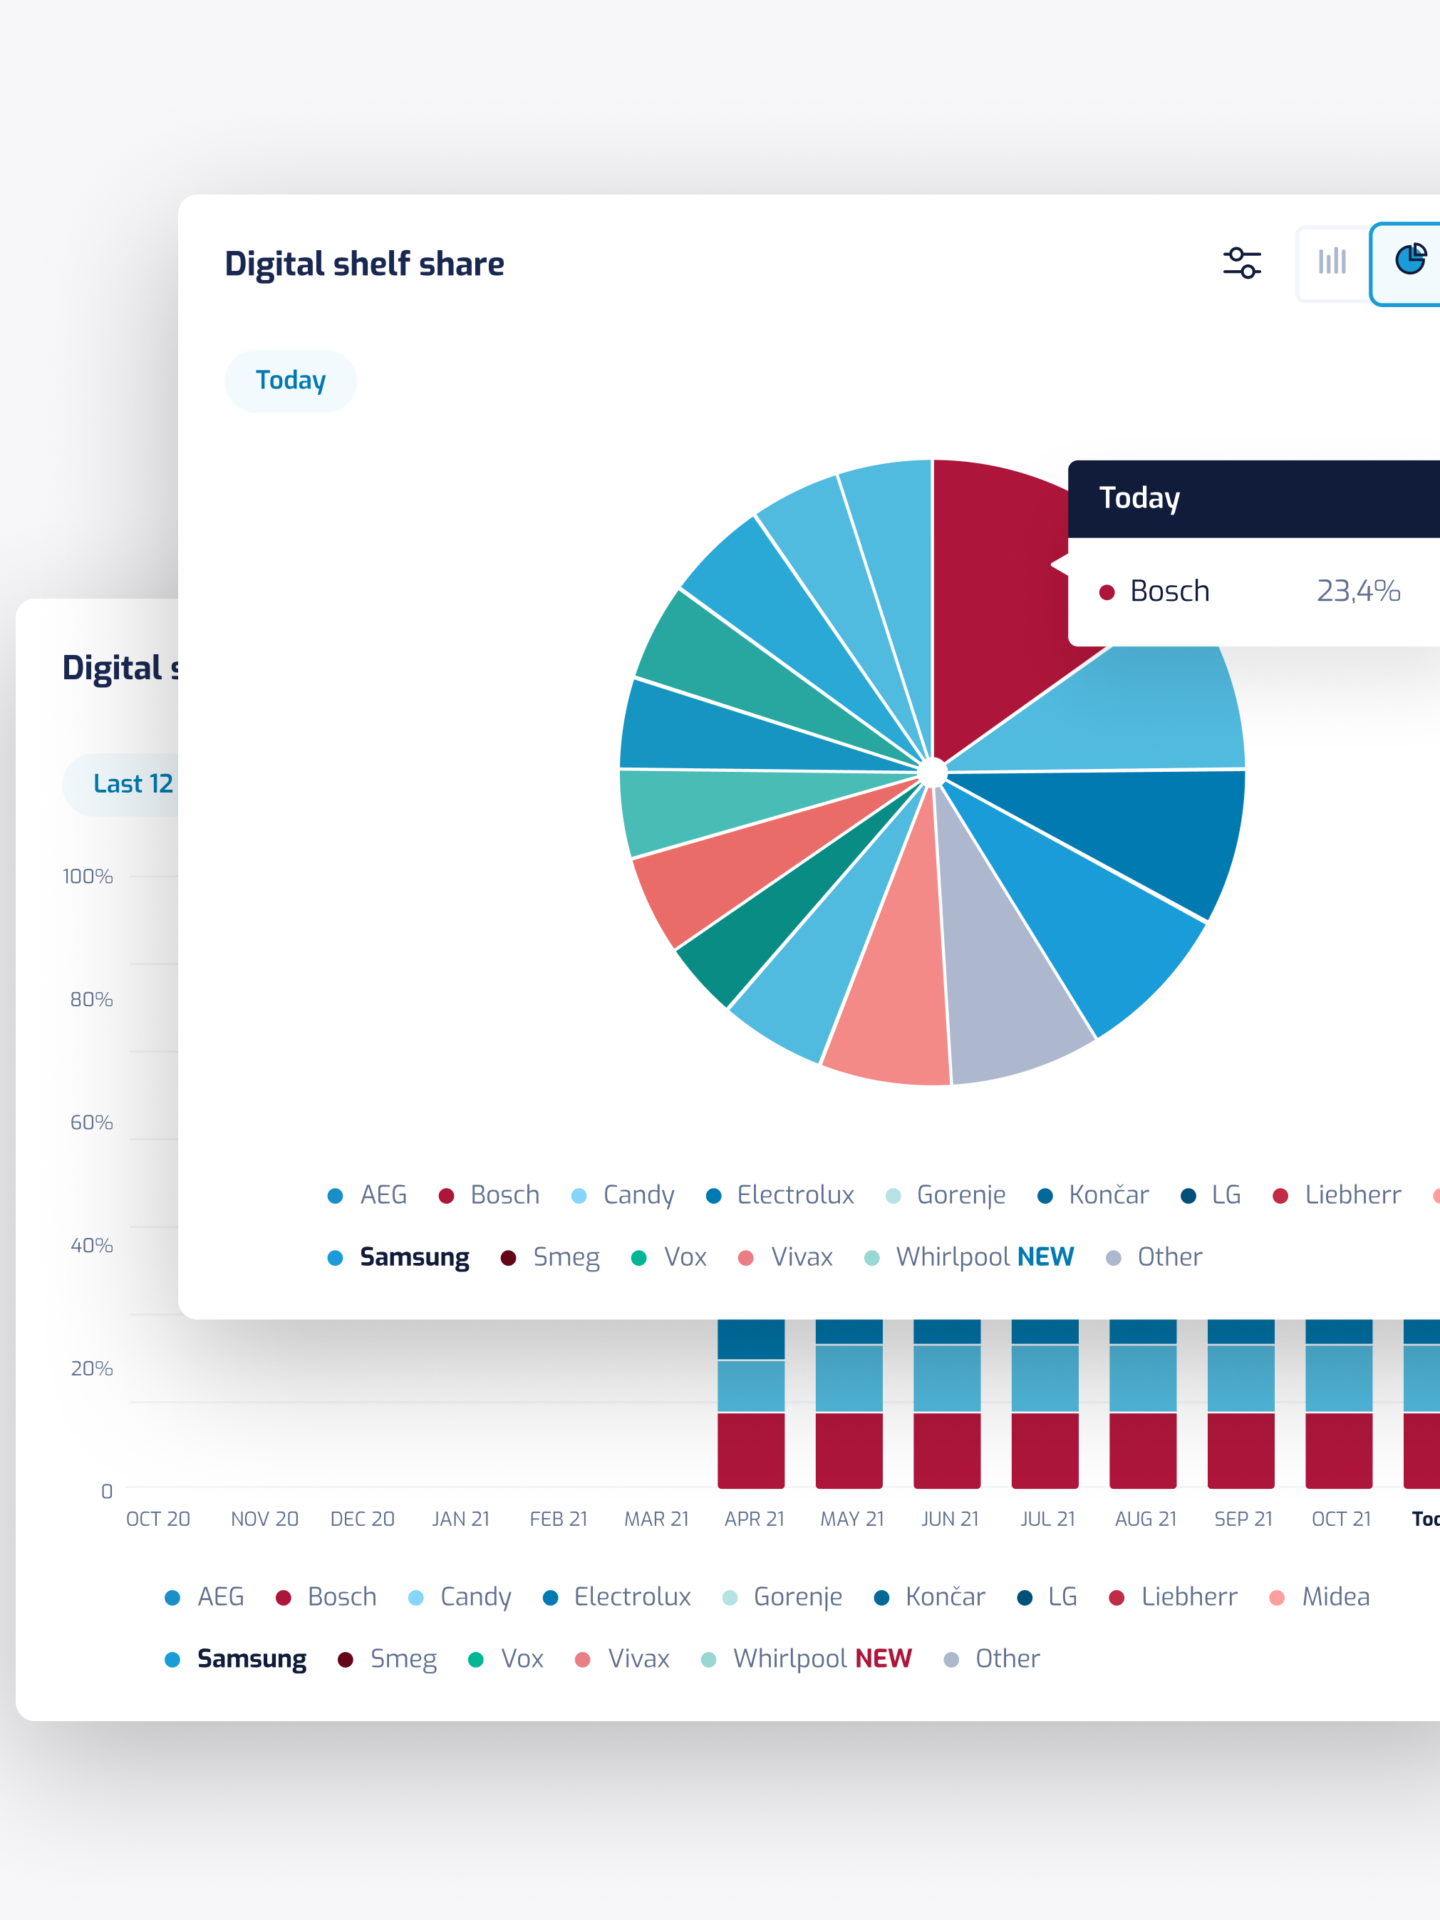
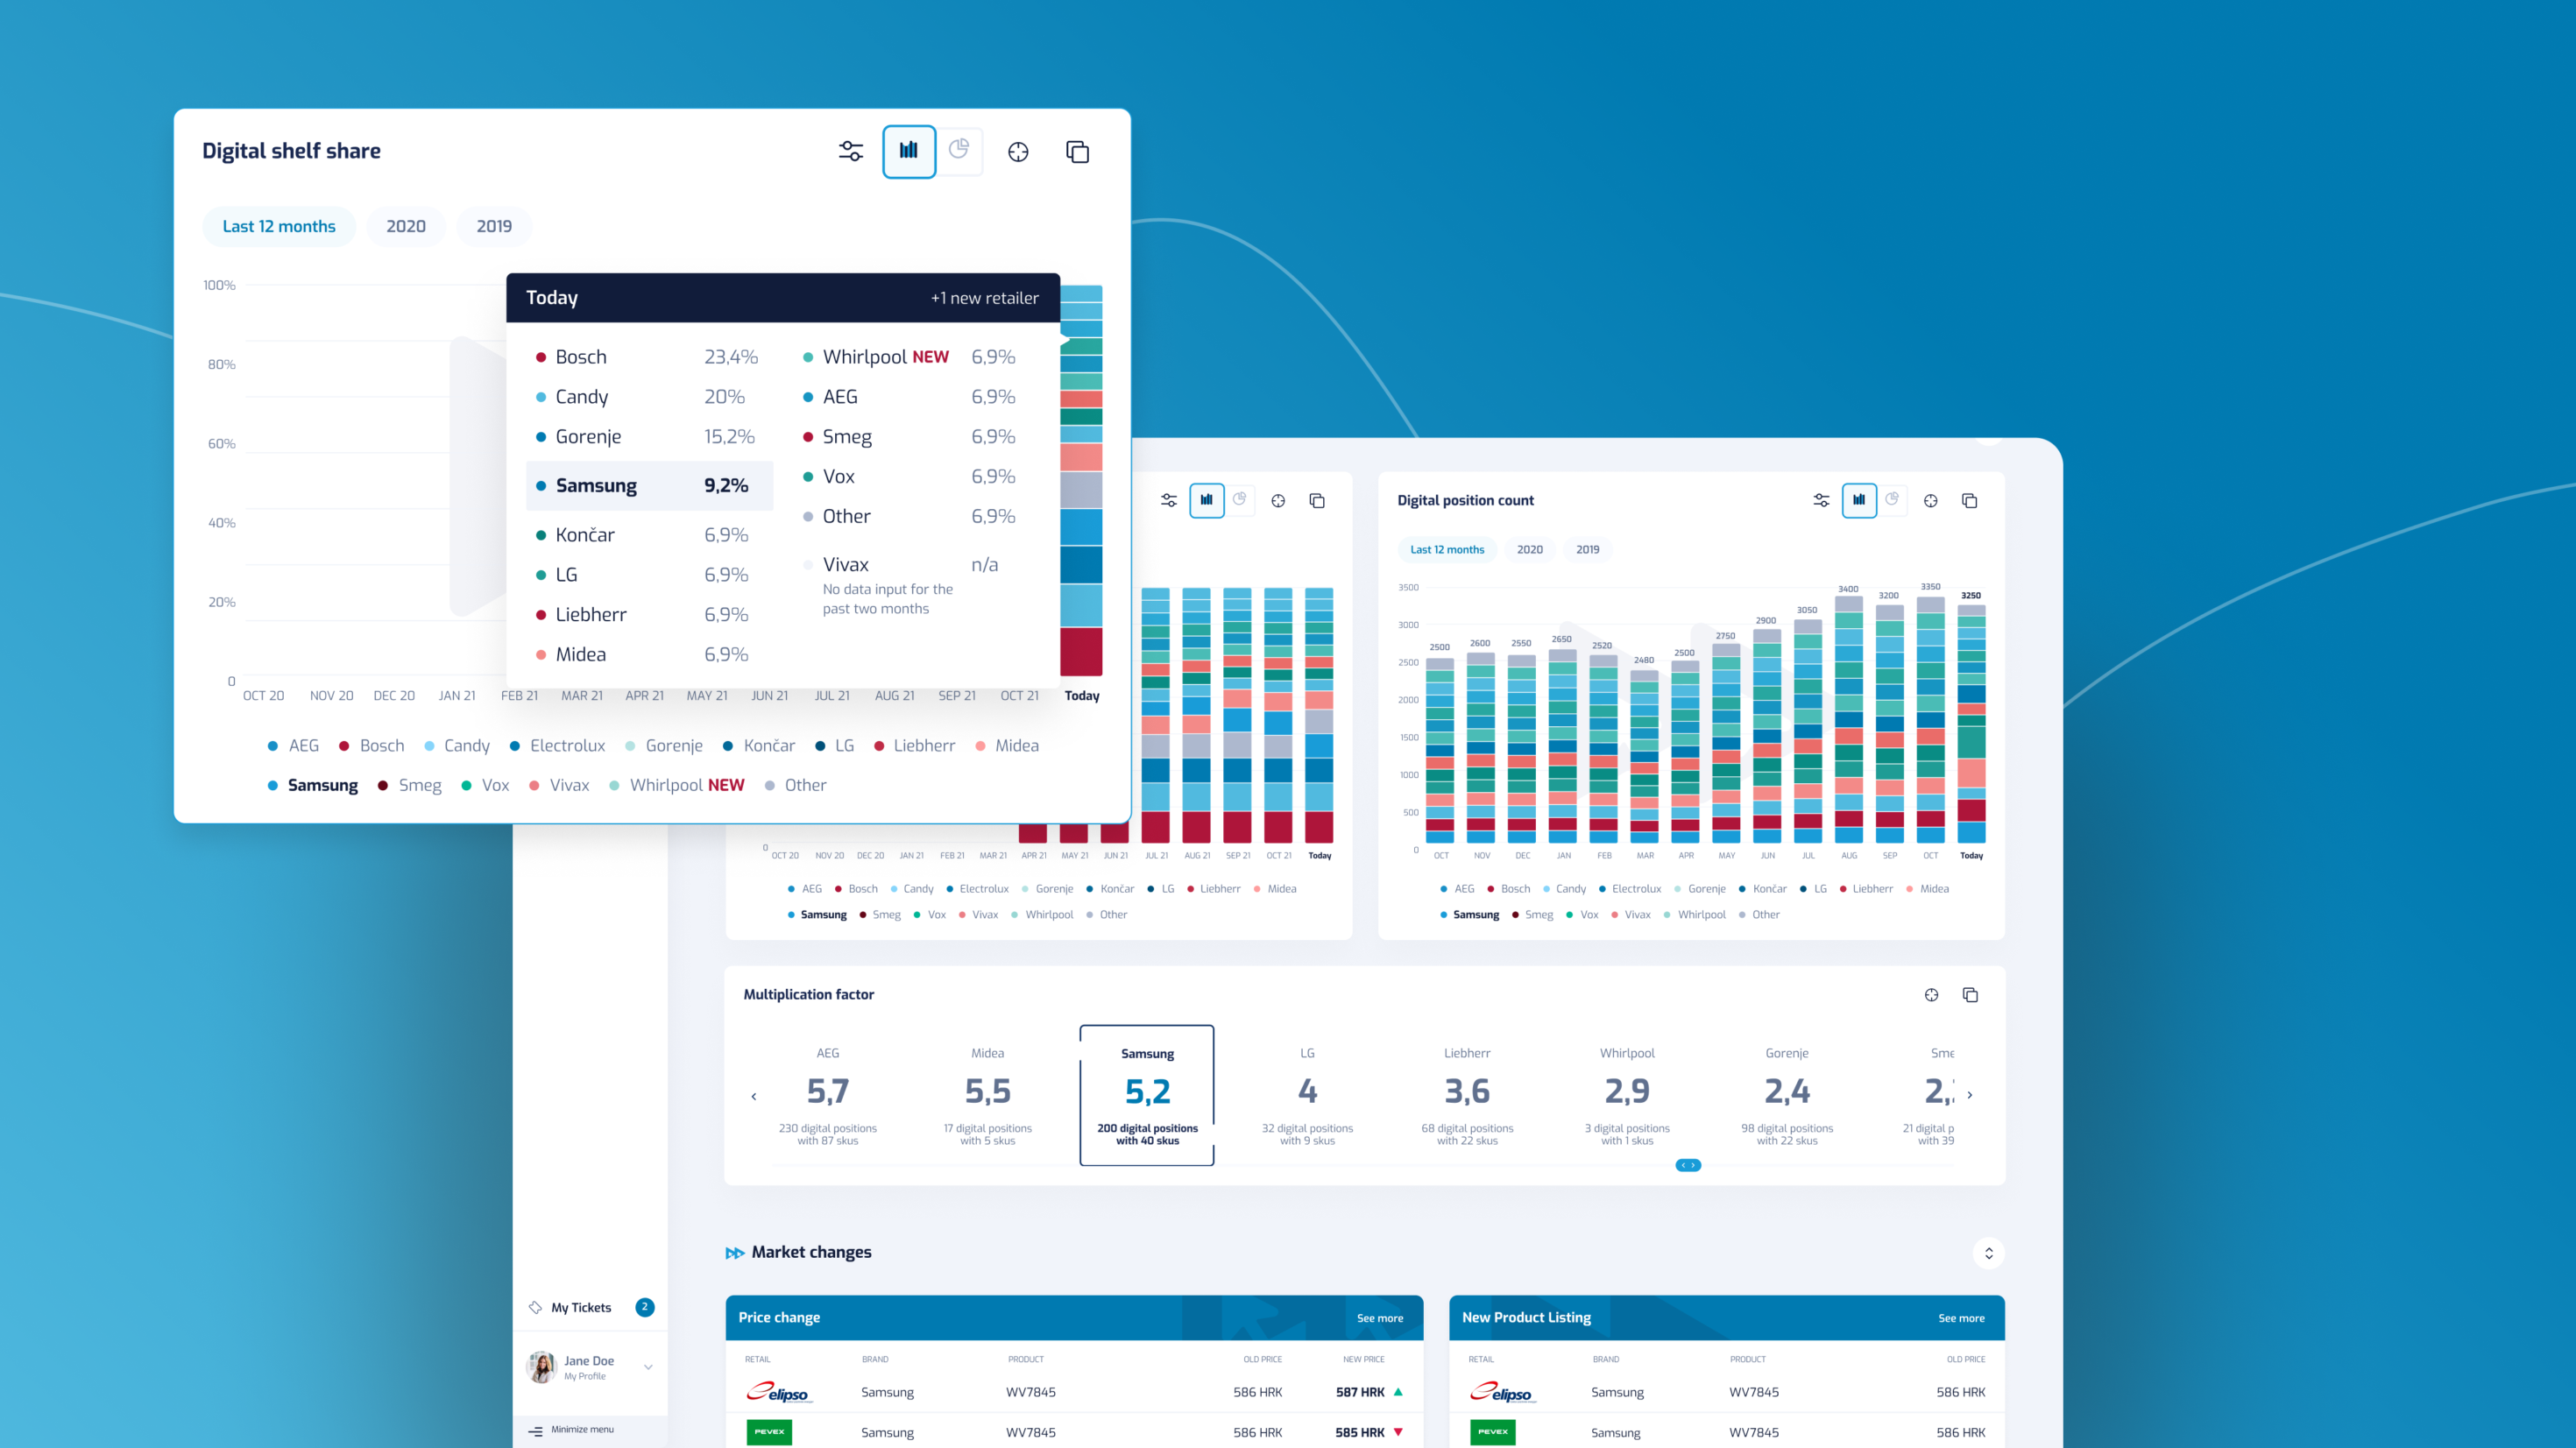
Graphs built around real metrics
We designed tailored graphs for each key metric, from digital shelf share and portfolio size to promotion performance and price competitiveness. Alternative views, time filters and clear chart descriptions give users flexible ways to slice the same data, compare brands or retailers side by side, and quickly spot shifts that need attention.
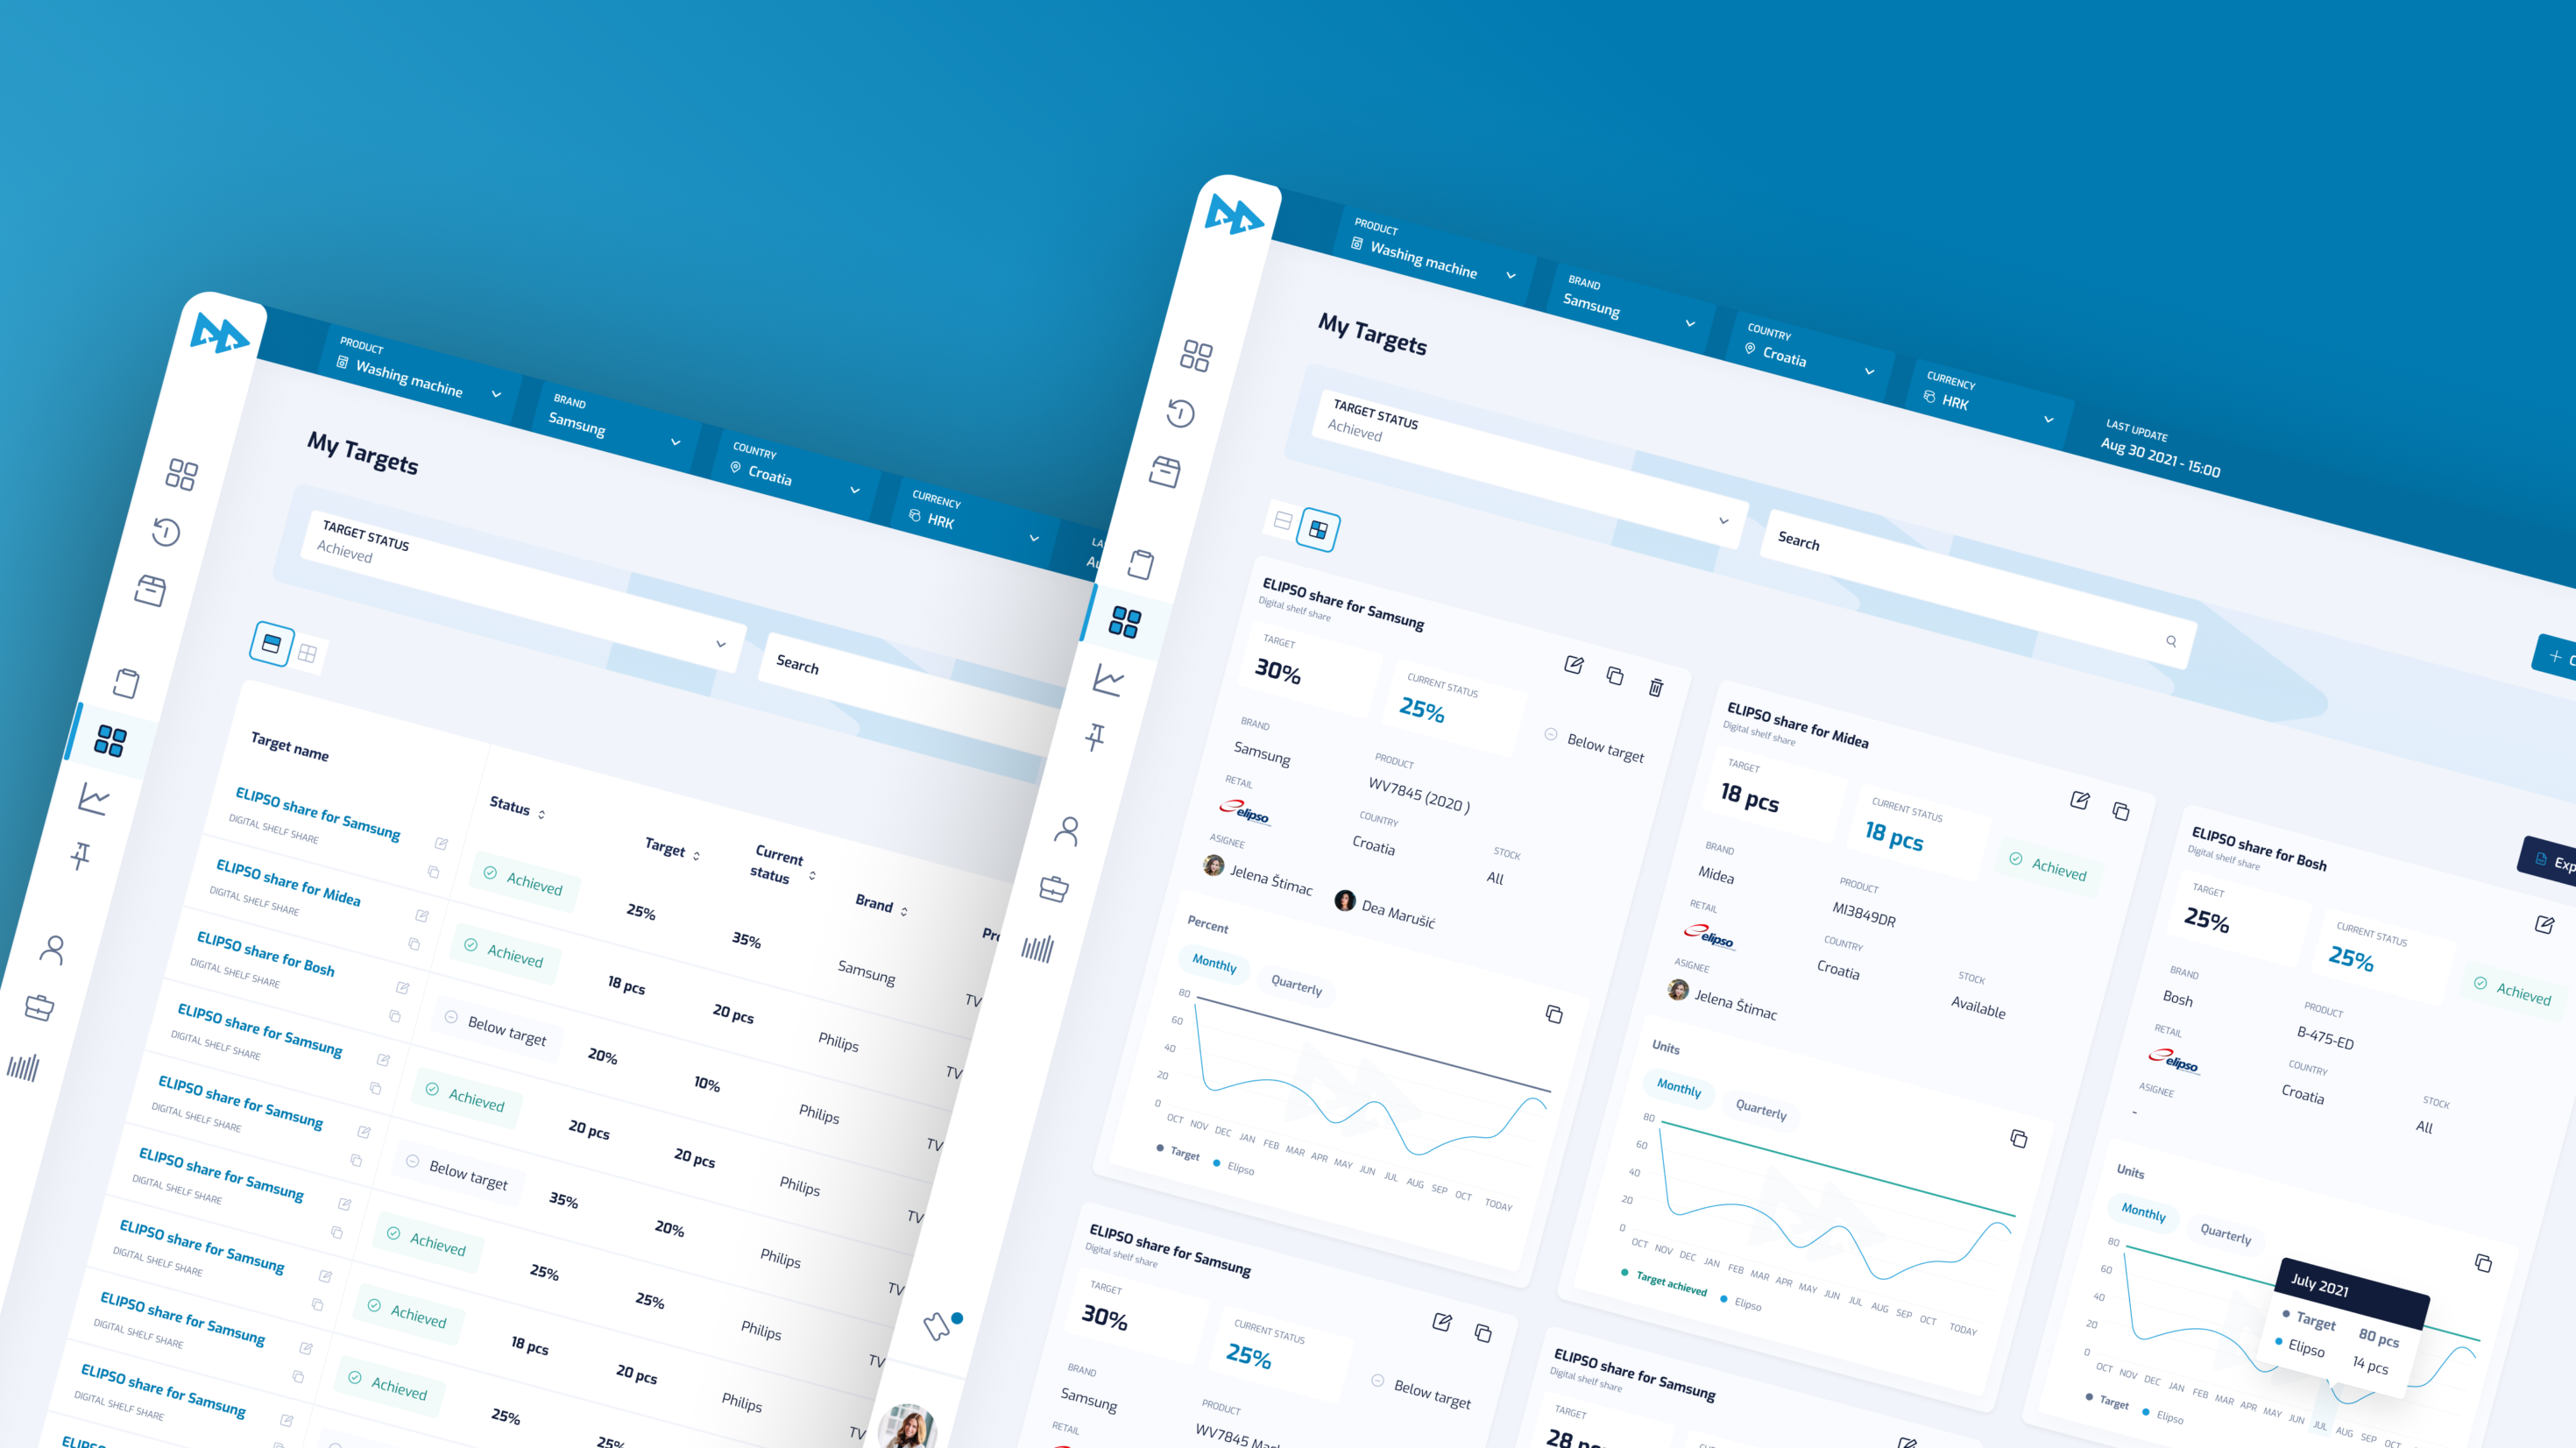
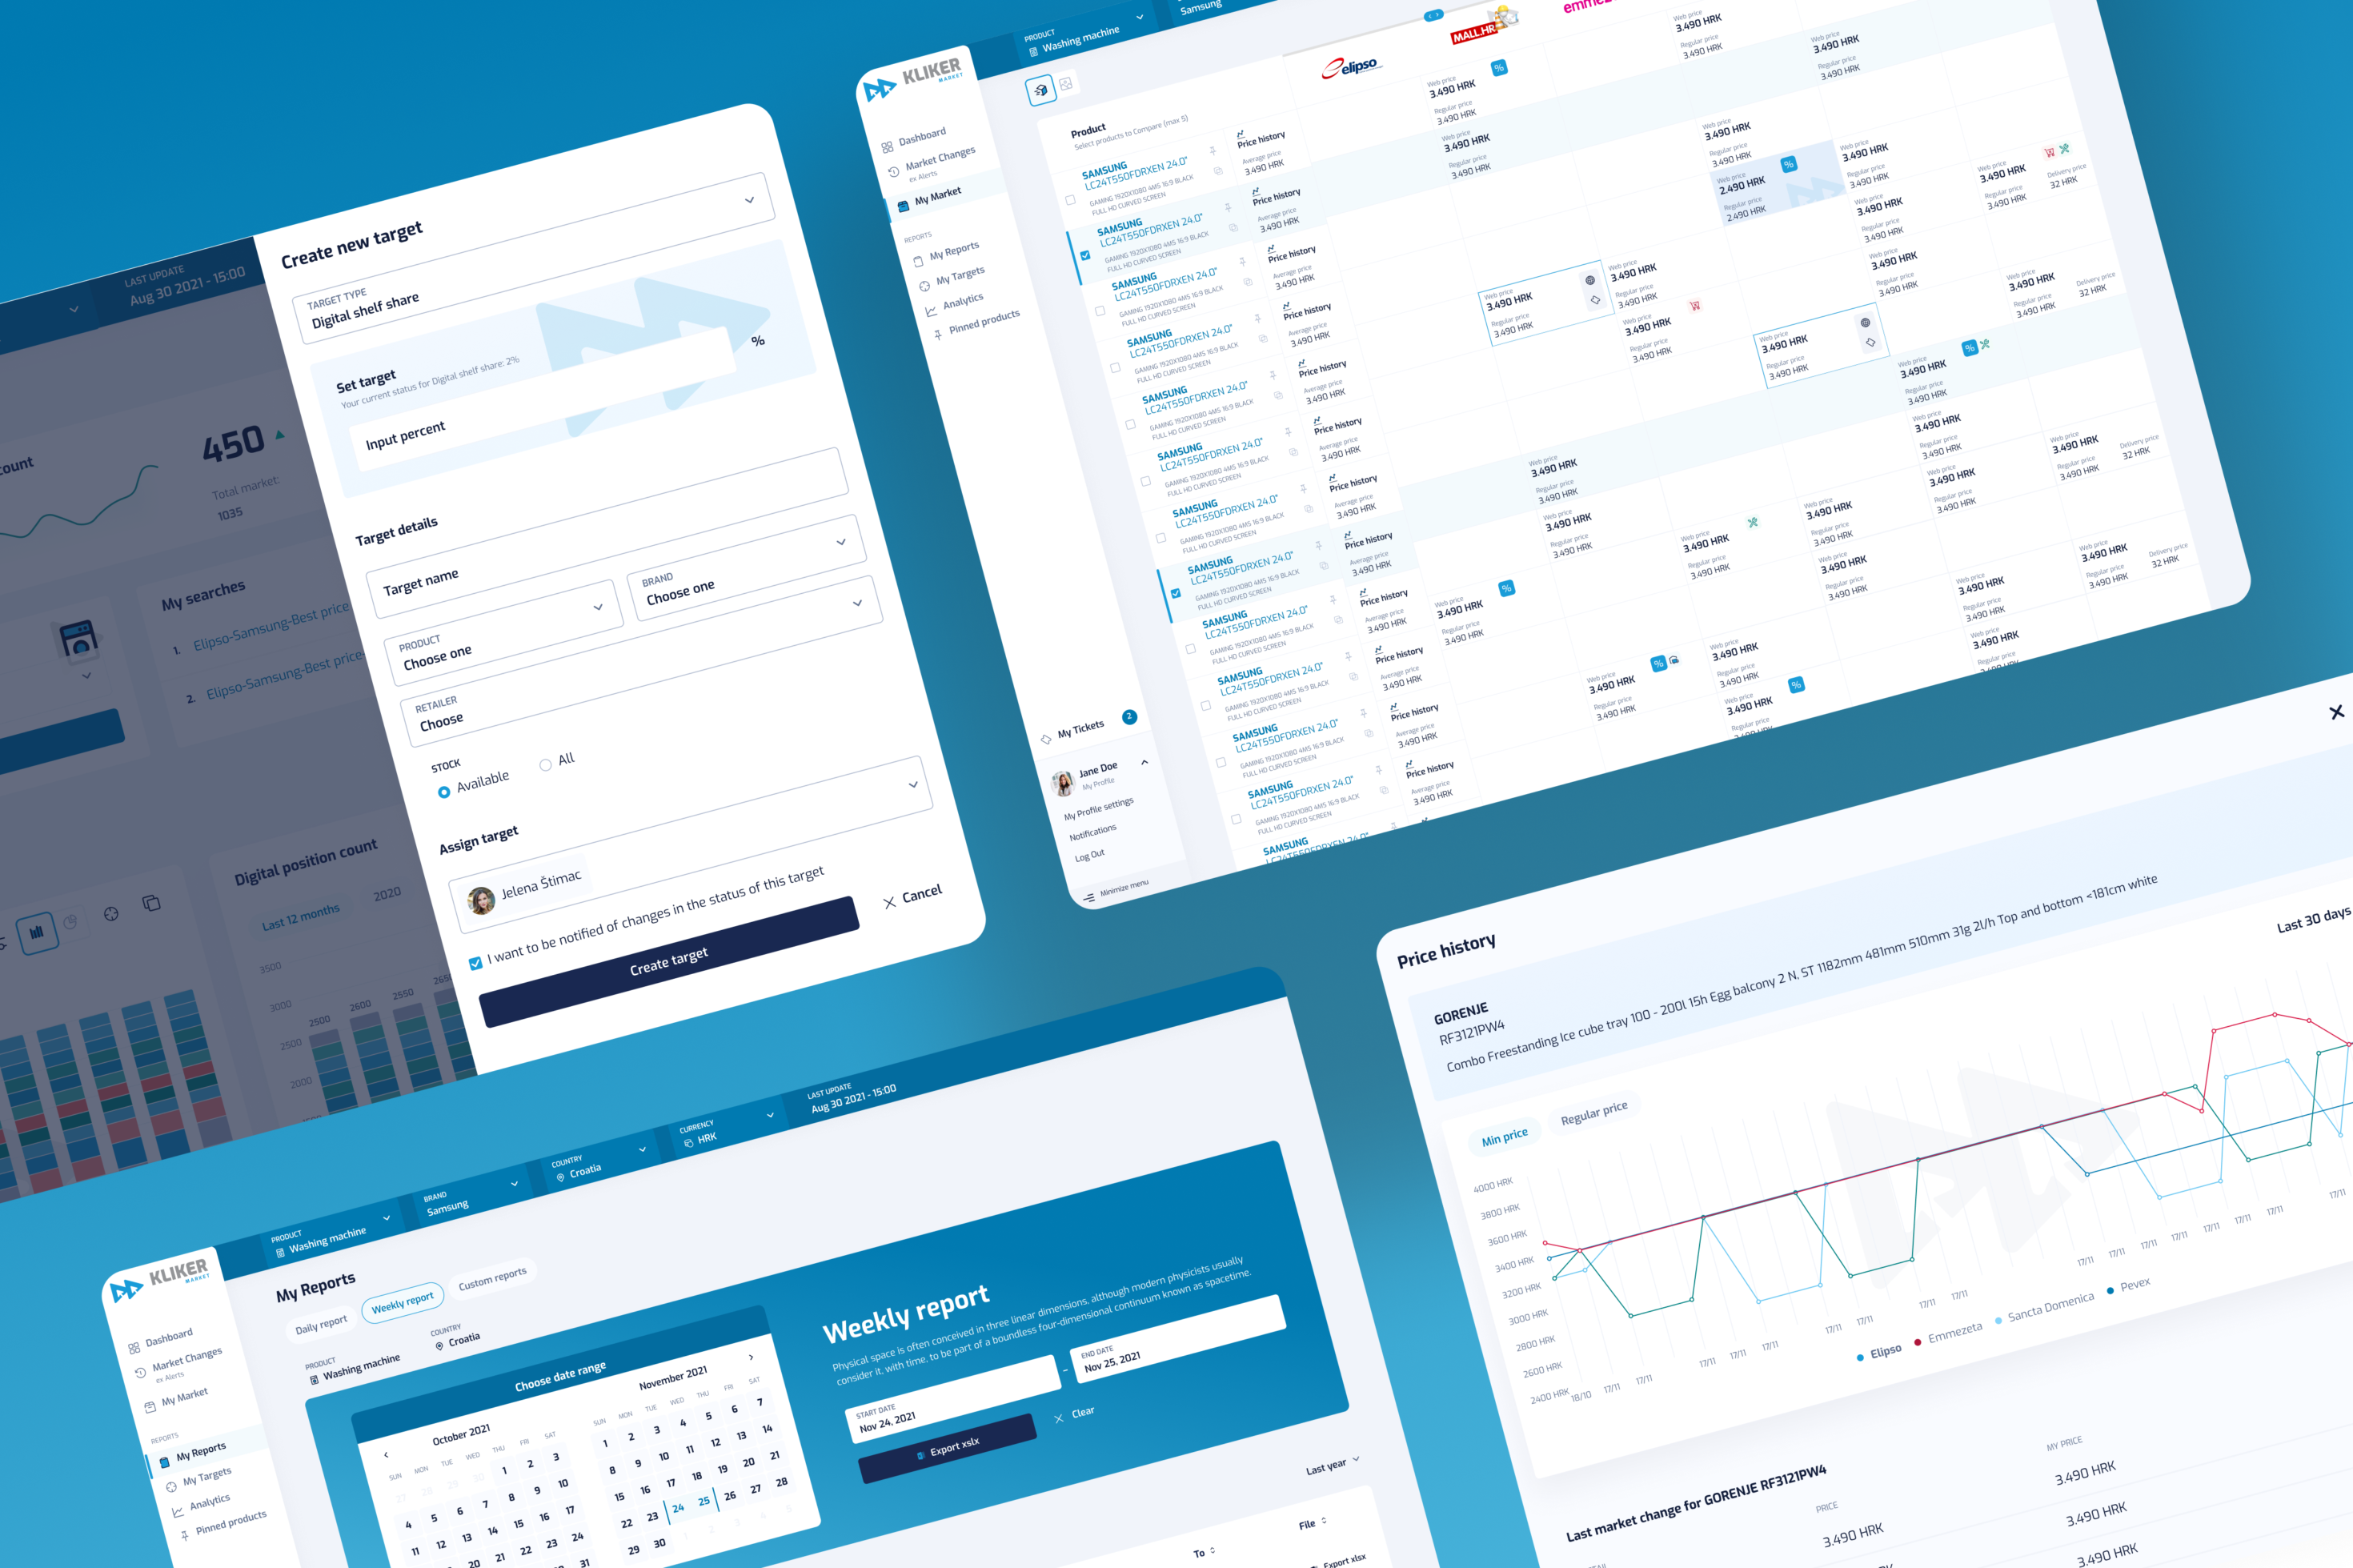
Workflows that adapt to teams
KLIKER Market adapts to the way different teams work. Power users can save frequently used combinations of filters and views as My searches, pin key SKUs in Pinned products, and define My targets for ongoing competitiveness tracking. When an analysis needs to be shared or repeated, they can export it as an Excel report and return to it later, building their own repeatable workflows instead of starting from scratch each time.
Human-friendly complex data
Although KLIKER Market works with dense market data, the interface speaks in clear, human language. Users can raise ad hoc queries directly from the screen they’re working in via the My tickets area, with relevant products and filters already attached, so questions feel like a quick conversation rather than a formal support process. Clear labels, helpful tooltips and explanatory empty states make it easier to understand what’s happening in the data and locate the right information.
Dea Marušić
Digital Business Development Manager
“The workflow was great, and deadlines were always met.”
Read full review on Clutch