


WooCommerce + Slemma: dashboard for eCommerce analytics

Business intelligence (BI) tools went mainstream in 2016. Those modern helpers are now capable to visualize all of your eCommerce data and users are starting to take this for granted. If you look at it closely, this “is” a sure sign of BI belonging to the commodity area.
Just a year ago, the whole niche was oriented towards enterprise users and only the big players were improving the field. Amazon Web Services (AWS), SAP, Microsoft and Google were leading up the whole BI development shabang and just last month AWS announced a cohort of big artificial intelligence (AI) tools like Lex, Rekognition, Athena, Glue, plus the general availability of its BI tool codenamed QuickSight. Google is also ramping up its tools gathered around the mature analytics suite Data Studio (a direct competitor to AWS QuickSight). On the other hand, Microsoft has a stable solution in the PowerBI set of tools paired with an already impressive Office 365 platform.
Mentioned companies are starting to push BI into the consumer market, showing plan prices in terms of “9,99 USD” and speaking in layman’s buzzwords – “dashboards”, “charts” and “shared reports”. Remember, BI lingo was all about “cubes”, “data warehousing” and “pivoting” – keywords used mainly in eCommerce Ph.D. theses. And that was just a year ago.
One interesting concept emerged from these B2C market penetrations – 3rd party dashboards – tools to gather all of your data, analysis and reports into one big container and display it with meaningful online visualizations. Major market players in the game are: GeckoBoard, Domo, Klipfolio, Chartio and Slemma. All pretty similar, these tools can connect to your existing “sources of truth” – Zendesk, Google Analytics, Github, Slack, JIRA, MailChimp and the rest of the SaaS bunch. It is up to the dashboard to vacuum it up and display it to your liking. Other data sources are also supported – SQL, NoSQL, data warehouses, CSV, XML or JSON data – they can all be connected to the dashboard of your choice.
But I will focus on one particular tool and data source here – Slemma + WooCommerce. Other services of this type are also mature (Geckoboard for instance), but we find Slemma useful and well-balanced for daily WordPress / WooCommerce BI needs. The tool handles one thing particularly well – various data sources and datasets. You can even connect Zapier to fill your tables with custom data. As for WooCommerce in particular, Slemma uses the new REST API to gather all of your Woo information.
1. You will need to enable REST API in the WooCommerce API settings panel, then generate your consumer key and secret from WooCommerce. Copy it, as you will need it later in Slemma
3. Open Slemma and press a down-right plus sign to add a new integration
4. Choose WooCommerce and enter saved keys and the URL to your WooCommerce store i.e. https://www.yourdomain.com/
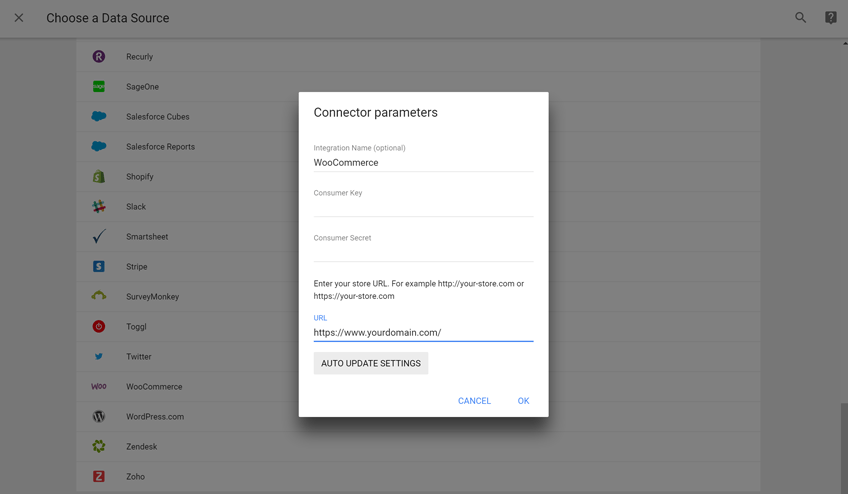
5. Click OK and Slemma will save your integration
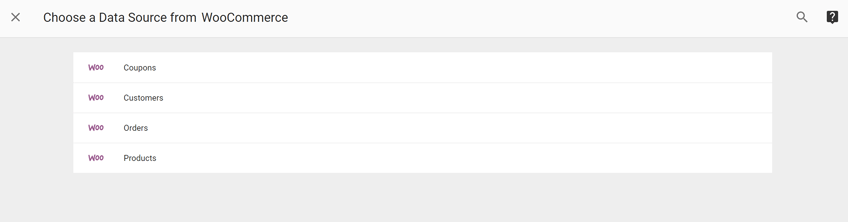
6. Now you can create 4 datasets inside Slemma: Coupons, Products, Orders and Customers
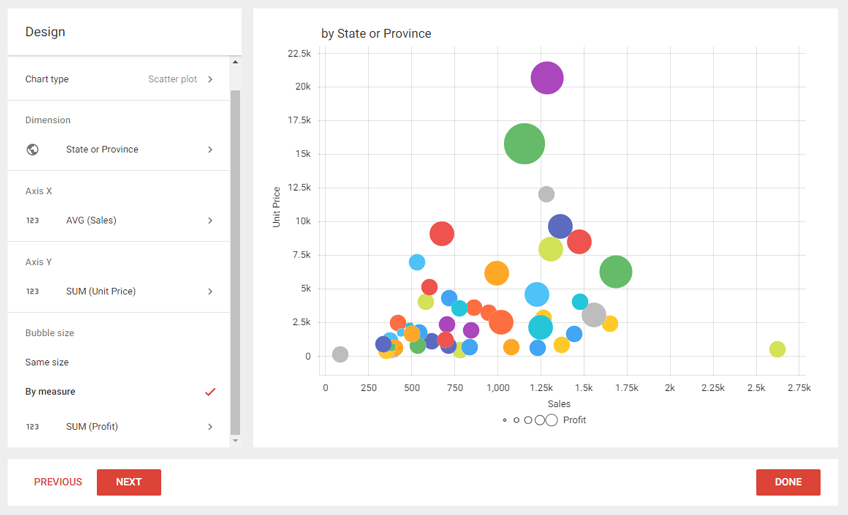
You are done with integrating Slemma and WooCommerce. All of your business and eCommerce data is available for charting purposes and you can use it to produce creative and relevant visuals to suit your analytics needs. There are tons of options for visualizing data with Slemma. The most useful ones are:
Scatter plot for visualizing 2 cross-referenced sales metrics (like Unit price and sales volume in this example) across on chosen dimension (like state, country, product name, product category etc.)
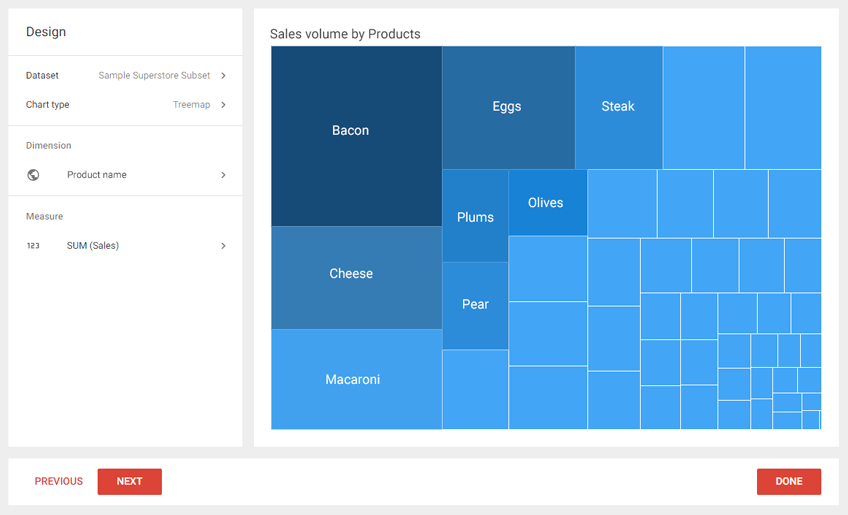
Popularity tree, a visual that will display sales by either state, product, product category or some other dimension of your choosing. Also, the tile size is based on the sales performance in this example.
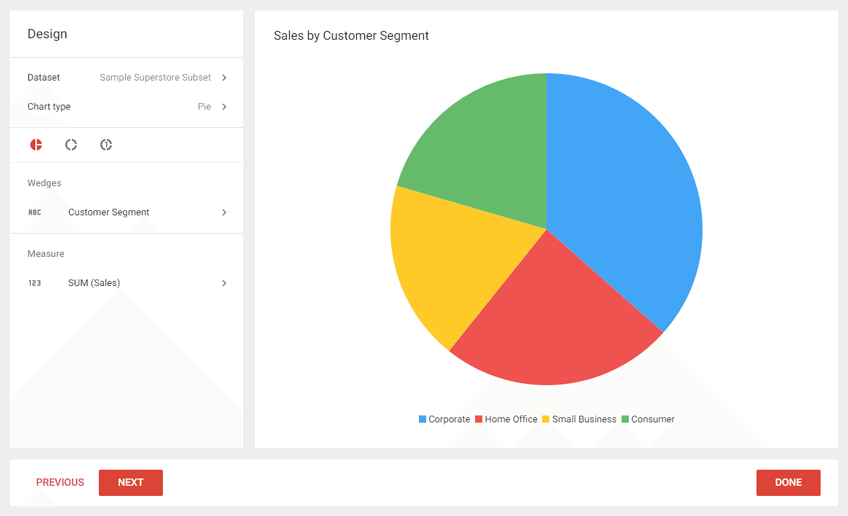
Pie or Doughnut breakdown of popular product categories, cause Homer Simpson.
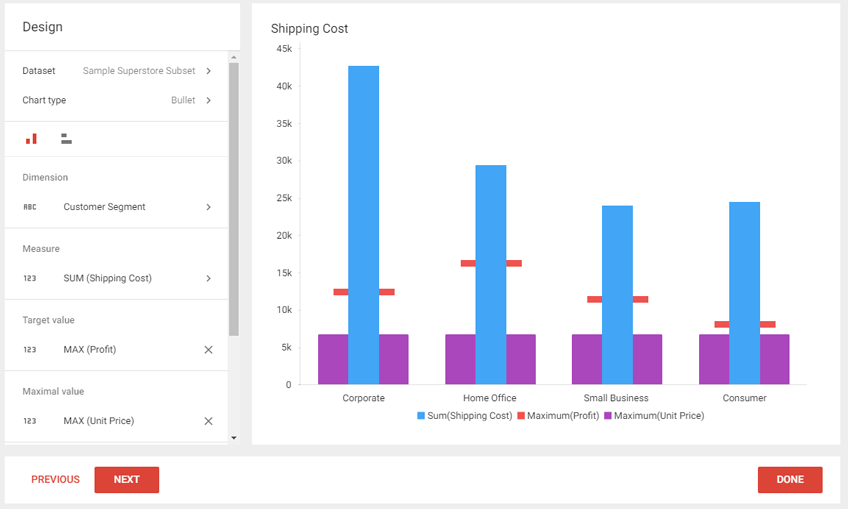
Gauge meters for clearly visualizing your sales metrics, goals and profits
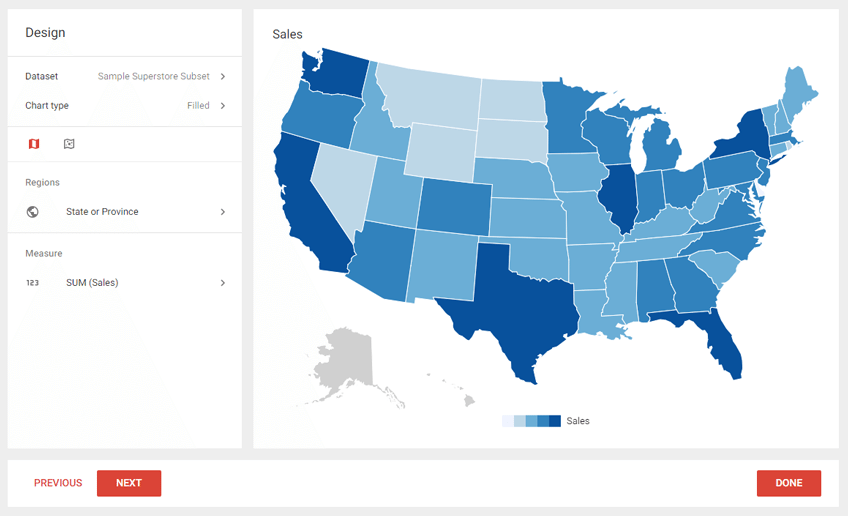
Map view of states (or countries) with the highest sales numbers
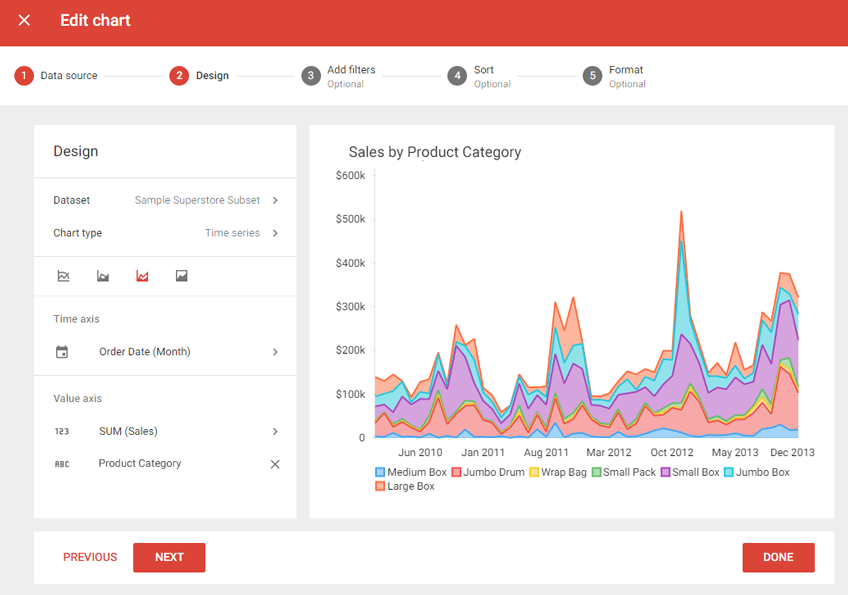
Combo time-series of your popular product categories over their sales volume, quantity or average sales numbers
The real power of all these analytics dashboards shines when you combine eCommerce data with other data sources. In the case of WooCommerce, two ideal candidates come to mind – Google Analytics and MailChimp. For instance, the WooCommerce Users data set holds detailed info about your users while Google Analytics holds overall website usage data. Try to play and experiment with these kinds of dashboards and data sources. The idea is to gain insight into valuable metrics and take action on them. Something is not possible if you only stare at the native WooCommerce orders list.
Did you find this tool and article interesting? Drop us a tweet at @neuralab or @kreshomir, comment or ask questions! We will be happy to give feedback and help you with eCommerce analytics tasks. Note: images and screenshots are taken in Slemma or edited from their knowledge base. You can find more useful info there: http://support.slemma.com/help_center. Featured photo of a kid interested in its surroundings by Teddy Kelley
Ex QBASIC developer that ventured into a web world in 2007. Leading a team of like-minded Open Source aficionados that love design, code and a pinch of BBQ. Currently writing a book that explains why ‘coding is the easier part’ of our field.